Wiki - click images
 |
Watershed:
is a land area that channels rainfall and snowmelt to creeks, streams,
and rivers, and eventually to outflow points such as reservoirs, bays,
and the ocean. Diagram: credit to Greenscapes North Shore Coalition |
 |
The carbon solubility pump:
Cold, high-latitude water can hold more carbon dioxide than warmer
water. If the water is under-saturated with CO2, gas molecules diffuse
across the air-sea boundary, and may also enter the water from bubbles
mixed down by breaking waves. In the surface ocean the gas reacts with
water molecules to create carbonic acid [H2CO3], which in turn
dissociates into hydrogen ions [H+] and bicarbonate ions [HC03-]. This
transition allows more CO2 gas to be dissolved in the water. The
surface ocean exchanges CO2 gas with the atmosphere at relatively short
time scales. Most of the anthropogenic carbon taken up by the ocean is
stored in the deep ocean, where it can remain for centuries (Wikipedia). |
 |
The biological pump
(or ocean carbon biological pump or marine biological carbon pump) is
the ocean's biologically driven sequestration of carbon from the
atmosphere and land runoff to the ocean interior and seafloor
sediments. In other words, it is a biologically mediated process which
results in the sequestering of carbon in the deep ocean away from the
atmosphere and the land. The biological pump is the biological
component of the "marine carbon pump" which contains both a physical
and biological component (Wikipedia). |
 |
Resillience: modstandskraft-
robusthed Sequestration:
sekvestrering - beslagleggelse - konfiskering - a chemical process in
which atmospheric carbon dioxide reacts with minerals in the presence
of water to produce insoluble carbonates. DIC: dissolved inorganic carbon. Upwelling: a process in which deep,
cold water rises toward the surface. Effluent:
wastewater from sewers or industrial outfalls that flows into surface
waters |
 |
Rates of change in human activity since the
beginning of the
Industrial Revolution. Significant increases in rates of change occur
around the 1950s in each case and illustrate how the second half of the
twentieth century has been a period of dramatic and unprecedented
change in human history. Reference: Steffen et al. (2011), Phil. Trans. R. Soc. 369, 842 |
 |
Map of the geological timeline, or the International Chronostratigraphic Chart, revised February 2022 |
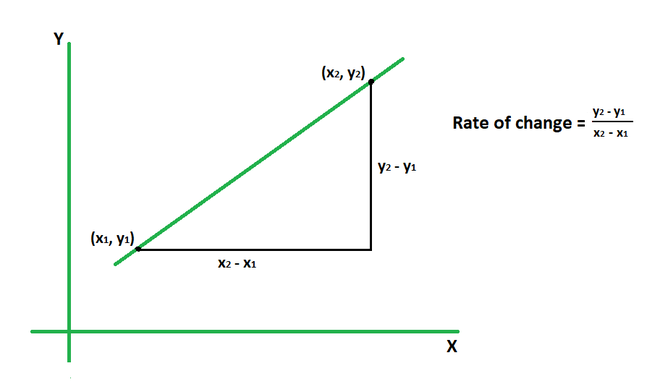 |
Definition rate of change: Slope thought of as the rate at which the dependent variable (eg. CO2 measured in ppm) changes relative to the independent variable (eg. time measured in years).The linear funcion y=f(x) is used in the plot. If the slope is increasing the rate of change is said to accelerate, and if the slope is decreasing the rate of change will be decellerating. |
 |
The Thermohaline circulation (THC) is a part of the ocean circulation that is driven by global density gradients created by surface heat and freshwater fluxes.The adjective thermohaline derives from thermo- referring to temperature and -haline referring to salt content, factors which together determine the density of sea water. Wind-driven surface currents (such as the Gulf Stream) travel polewards from the equatorial Atlantic Ocean, cooling en route, and eventually sinking at high latitudes (forming North Atlantic Deep Water). This dense water then flows into the ocean basins.While the bulk of it upwells in the Southern Ocean, the oldest waters (with a transit time of about 1000 years) upwell in the North Pacific. Extensive mixing therefore takes place between the ocean basins, reducing differences between them and making the Earth's oceans a global system. The water in these circuits transport both energy (in the form of heat) and mass (dissolved solidsand gases) around the globe (Wikipedia). |
 |
This figure shows temperature change over
the last 65 million years. The intermediate portion of the
record
is
dominated by large fluctuations in the mass of the Antarctic ice sheet,
which first nucleates approximately 34 million years ago, then
partially dissipates around 25 million years ago, before re-expanding
towards its present state 13 million years ago. Significant growth of
ice sheets did not begin in Greenland and North America until
approximately 3 million years ago, following the formation of the
Isthmus of Panama by continental drift. This ushered in an era of
rapidly cycling glacials and interglacials. Also appearing on this
graph
are the Eocene Climatic Optimum, an extended period of very warm
temperatures, and the Paleocene-Eocene Thermal Maximum (labeled PETM).
The PETM is a very short lived high temperature excursion associated
with
rapid buildup of greenhouse gases in the atmosphere (Wikipedia. Map by
R. Routledge/J. Hansen) |
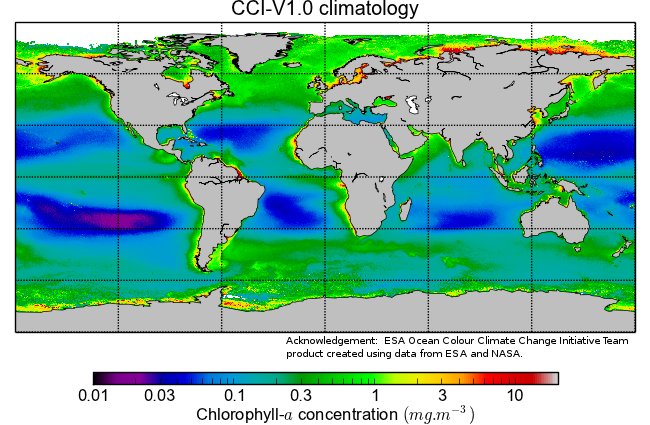 |
This map of yearly
average oceanic chlorophyl-a was without additional notes
floating on
the web, and therefore lots to ponder over!. Phytoplankton, as with
plants, need sunlight, nutrients
(nitrogen, phosphorus, iron et.c) and CO2 to grow where
nutrients and
sunlight (according to the map) for at least part of the year must be
abundant 1) at high and
low latitudes
2) where costal upwelling happen (African; South American coast) and 3)
where rivers pour enriched water into the ocean (Amazonas, Don, Donau,
Ob, Lena et.c.). High productivity in the Baltic and Black sea is
caused by fertilisation from agriculture, I guess (in the Baltic sea
of
no benefit as the seabed in these shallow waters go anoxic when
plankton decompose
after the seasonal bloom). Winds may be of significance (?) in
phytoplankton
distribution as the Pacific eastern
bound trade wind (Panama-Indonesia) known already
to the old circumnavigators fits with part of the Pacific
chlorophyl-a distribution - and of course oceanic currents also must be
pivotal - and so on and on :):). |
 |
Photosynthesis is a chemical
reaction during which light energy is converted into chemical energy.
Carbon dioxide (CO2) and water are transformed into glucose
(C6H12O6) and oxygen. The reaction can
be simplified as: 6 CO2 + 6 H2O ==> C6H12O6
+ 6 O2
.The process is carried out in chloroplast (an organelle of a plant
cell) whose most important part is a green dye, namely Chlorophyll a
and b. The whole procedure is divided into two phases – the
light-dependent and the light-independent (Calvincycle). Energy rich
ATP molecules form in the light dependent phase and afterwards interfer
with carbon dioxide in the light-independent phase building sugars. In
the light dependent phase oxygen is formed and disposed of as a waste
product. The beautiful scheme is free under a Creative Commons
License thanks to University of Birmingham,UK |
 |
The majority of what
is called blue carbon is
carbon dioxide that has dissolved directly into the ocean. Much smaller
annual amounts are stored
in subsea sediments, coastal vegetation and soils and in ocean life,
from whales to phytoplankton. Salt marshes along coasts "capture and
hold" carbon, acting as a carbon sink. These coastal systems, though
much smaller in size than the planet's forests, sequester carbon at a
much faster rate and can store the sequestered carbon for milennias.The
depicted salty marsh (from Limfjorden in Denmark) is frequenly flooded
and dry up in the summer. In springtime herons hunt, swans hatch and
(noisy) migrating geese rest in the fields (text partial from
climate.gov). |
 |
Spring phytoplankton
blooms
color the North Sea, lying between Norway, Great Britain, and Northern
Europe. The North Sea is a very diverse environment, with marked
variations in depth, temperature, and salinity, which influences the
distribution of the fauna residing in the basin. The ecosystem is
unfortunately affected by human activity in this densely populated
area, where overfishing, dredging and pollution are some of the factors
that contribute to its degradation. This image was captured by the OCI instrument aboard PACE on May 15, 2024 (from NASA PACE satellite website). |
 |
Billedet er fra
statusrapporten "Iltsvind
i
danske farvande" fra Nationalt Center for Milj� og Energi datert
4/10-24. Rapporten indeholder bl.a. grafer som viser landsgennemsnit for m�nedlig nedb�r, landsgennemsnit for ugentlig lufttemperatur, landsgennemsnit for ugentlig middelvindhastighed og ugentlig bundvandstemperatur i de indre danske farvande. Report from DCE / Institute for Ecoscience, Aarhus Universitet on oxygen depletion in danish waters autum -24 (with summary in english). |
 |
Humanity
has for several decades been aware that global growth in population,
gross domestic product (GDP), fertilizer consumption, amount of
domesticated land, atmospheric NH4 and CO2 content, international
tourism, sea surface temperature, overfishing and material consumption
for the last centuries, and especially since the 1950's, has increased
in a linear or exponential way, while in the same time there has been a
evident decline in global biodiversity and amount of tropical rain
forests. Question: Most people on earth see upon the consequences of these growth processes (e.g. wild fires, flooding, less biodiversity) as negative. Why is humanity not able to control these growth processes? ( click image for answer - thank you to ChatGPT :) ) . |
 |
The nitrogen cycle
is the process by which nitrogen is converted into multiple chemical
forms as it circulates among atmosphere, terrestrial, and marine
ecosystems. The conversion of nitrogen can be carried out through both
biological and physical processes. Important processes in the nitrogen
cycle include fixation, ammonification, nitrification, and
denitrification. 78% of the Earth's atmosphere is molecular nitrogen
(N2),making it the largest source of nitrogen. However, atmospheric
nitrogen has limited availability for biological use, leading to a
scarcity of usable nitrogen in many types of ecosystems. The nitrogen
cycle is of particular interest to ecologists because nitrogen
availability can affect the rate of key ecosystem processes, including
primary production and decomposition. Human activities such as fossil
fuel combustion, use of artificial nitrogen fertilizers, and release of
nitrogen in wastewater have dramatically altered the global nitrogen
cycle. Human modification of the global nitrogen cycle can negatively
affect the natural environment system and also human health (Wikipedia). |
 |
The phosphorus
cycle is the movement of phosphorus through the lithosphere,
hydrosphere, and biosphere. Unlike many other biogeochemical cycles,
the atmosphere does not play a significant role in the movement of
phosphorus, because phosphorus and phosphorus-based compounds are
usually solids at the typical ranges of temperature and pressure found
on Earth. Therefore, the phosphorus cycle should be viewed from whole
Earth system and then specifically focused on the cycle in terrestrial
and aquatic systems. Locally, transformations of phosphorus are
chemical, biological and microbiological: the major long-term transfers
in the global cycle, however, are driven by tectonic movements in
geologic time. Humans have caused major changes to the global
phosphorus cycle through shipping of phosphorus minerals, and use of
phosphorus fertilizer, and also the shipping of food from farms to
cities, where it is lost as effluent (Wikipedia). |
 |
We now know the oceans acidify in accordance with
rising atmospheric CO2 levels - when atmospheric CO2
force its way into oceans the weak acid H2CO3 is
formed, followed by a stepwise dissociation resulting in a increase in
hydrogen ions (H+) and - because of complex ocean chemistry
- reduced availability of carbonate ions. The graph illustrate how the
seas around the Mauna Loa observatory in Hawaii is acidifying. On a
global scale acidification of the oceans is not uniform where e.g. pH
in the Baltic Sea is stable based on measurements over the last 50
years. What set the Baltic Sea apart from Hawaii is - brakish water,
high biological productivity (e.g. cyanobacteria blooms), outflow from
rivers draining limestone areas (Oder, Vistula) plus other sources of
nutrient input, where e.g the map
that demonstrate yearly average oceanic
chlorophyl-a reveal Hawaii is located in an area with sparse biological
productivity. The ultimative factor contributing to a stable pH in the
Baltic sea - influenced by the factors mentioned - is a high total alkanity (the concept is for
me hard to understand and I just look upon it as a buffering system).
Total alkalinity is defined as: excess of proton acceptors from weak
acids over proton donors. (ref: GOA-ON / Karol Kulinski, Polish
Institute of Oceanology) |
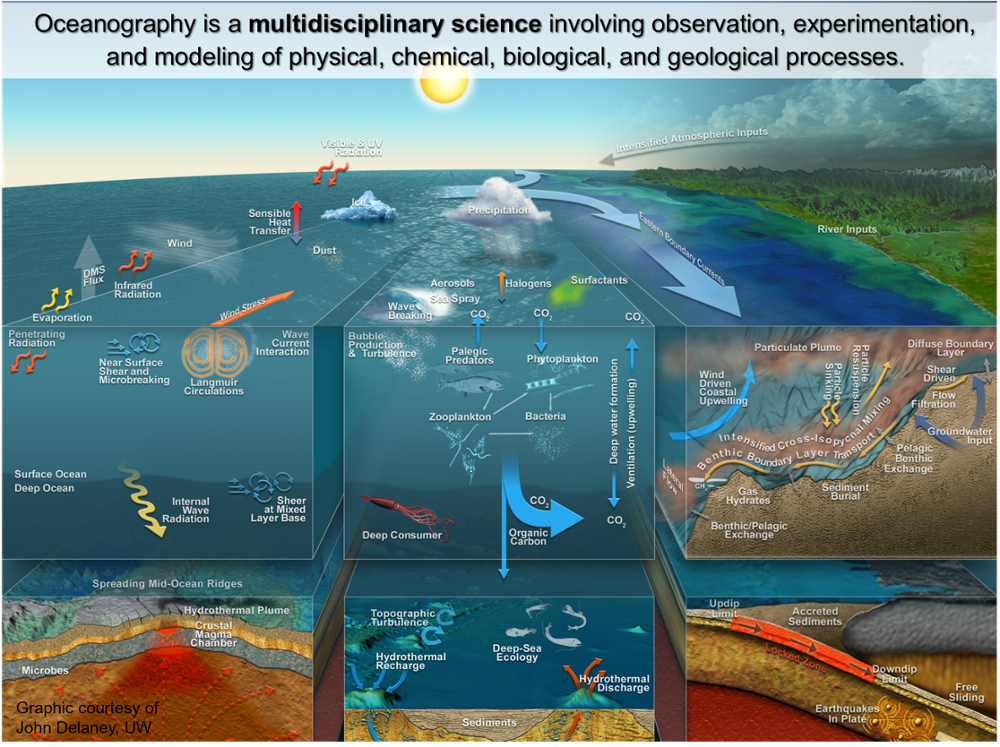 |
This detailed plate on
oceanography by John
Delaney offer us an organized way to make sense of a part of the
world.
Oceanography is a multidisciplinary science involving observation,
experimentation and modeling physical, chemical, biological, and
geological processes - difficult subjects to study, and even tougher if
it as extra will demand scuba-diving. The audio-snippet by Paul
Beckwith
(from a YouTube video) give us a fast walk-through of the illustration,
starting from
upper right and then counter-clockwise. Credits to John Delaney, UNI Wisconsin for map and Paul Beckwith, YouTube |
 |
The water cycle is a biogeochemical
cycle that involves the continuous change in form of water on, above
and below the surface of the Earth across different reservoirs. The
mass of water on Earth remains fairly constant over time. However, the
partitioning of the water into the major reservoirs of ice, fresh
water, salt water and atmospheric water is variable and depends on
climatic variables. The water moves from one reservoir to another, such
as from river to ocean, or from the ocean to the atmosphere due to a
variety of physical and chemical processes. The processes that drive
these movements, or fluxes, are evaporation, transpiration,
condensation, precipitation, sublimation, infiltration, surface runoff,
and subsurface flow (Wikipedia / USGS). |